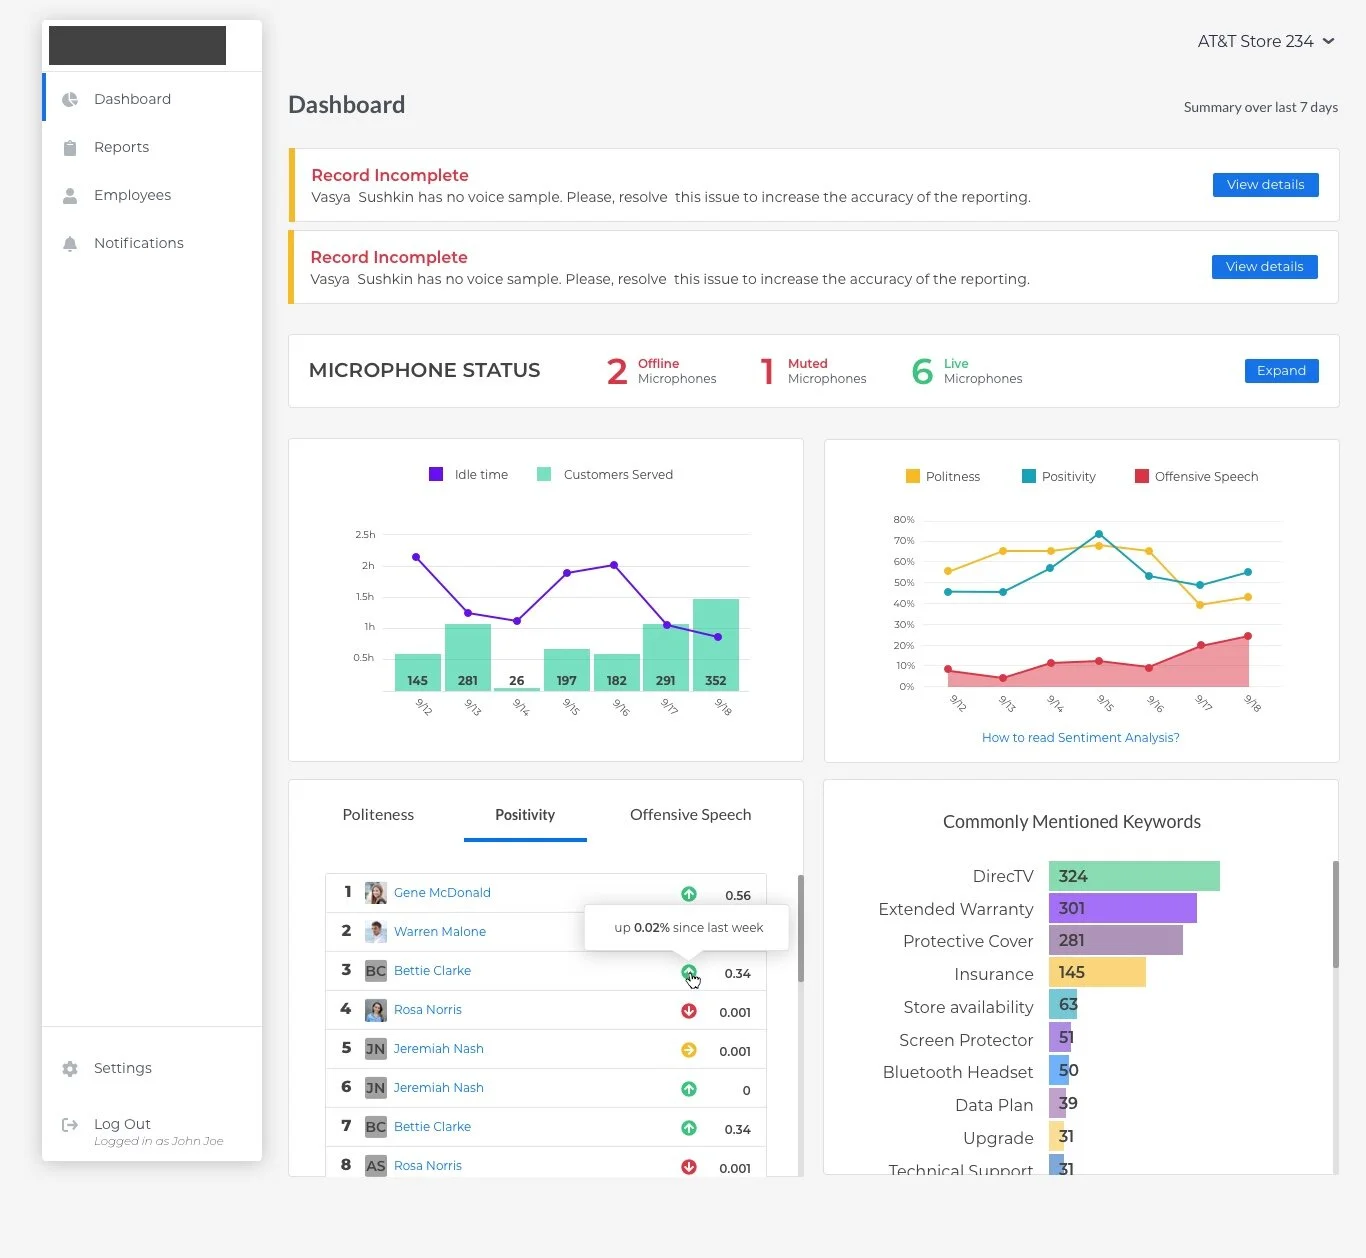
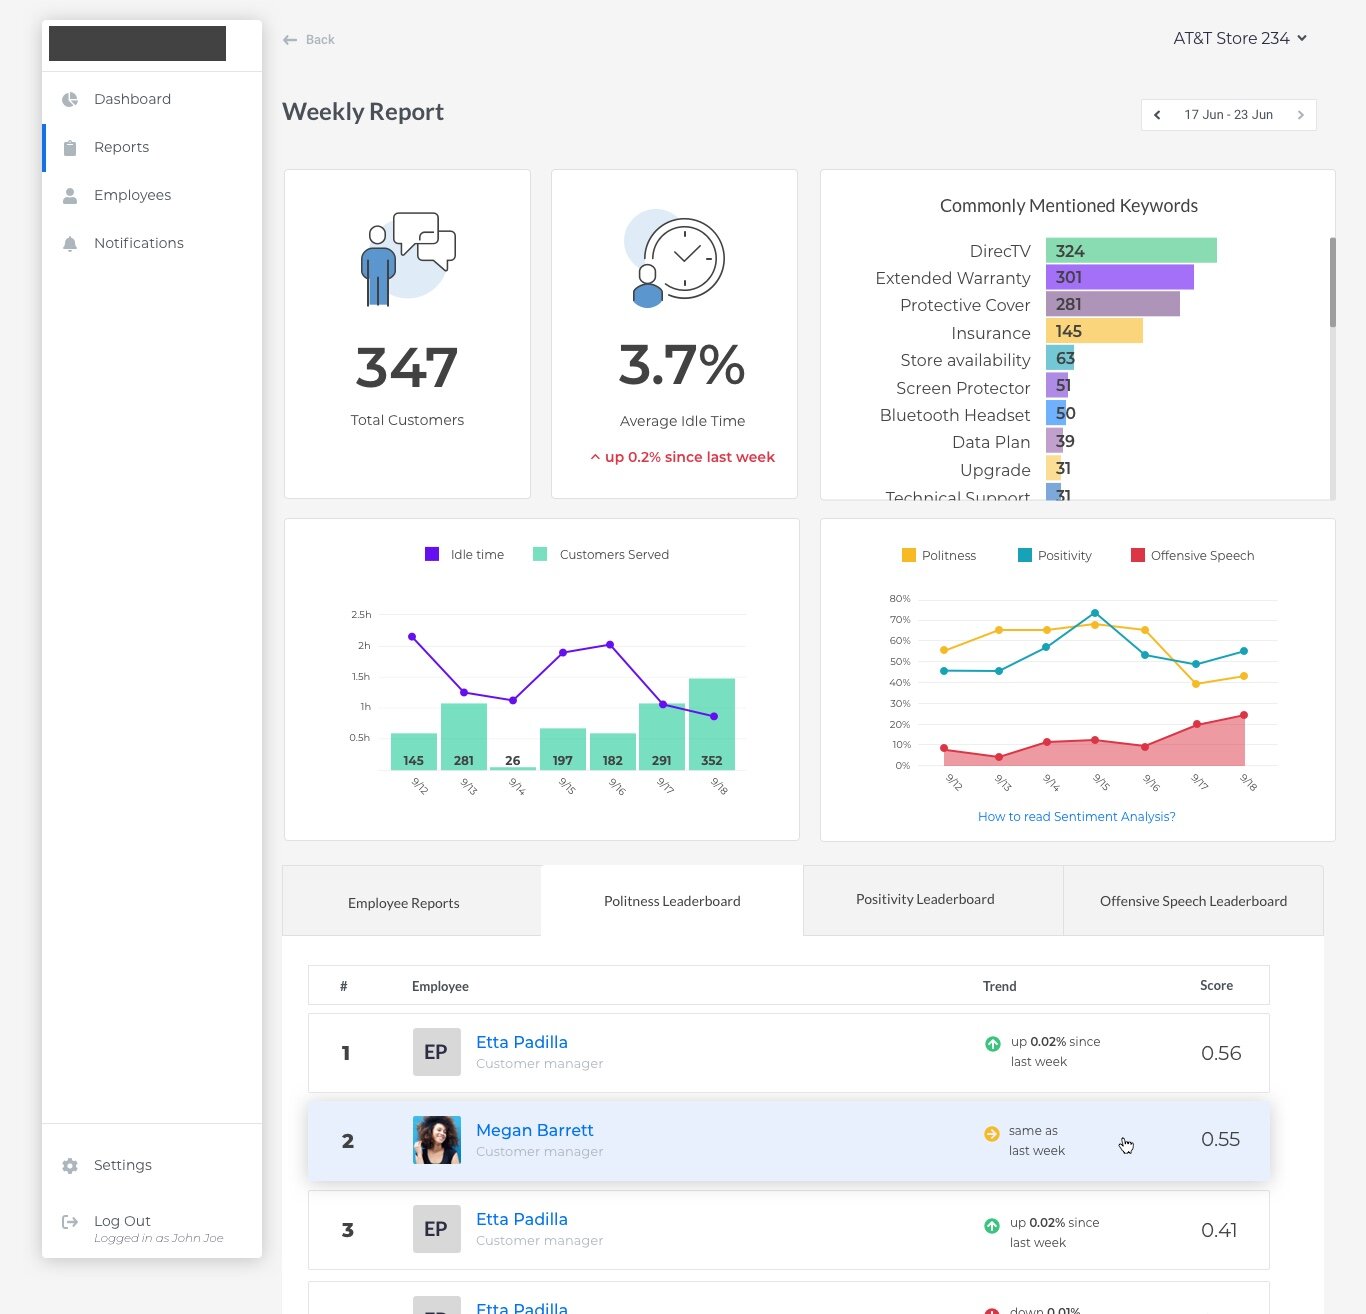
Employee Dashboard
Designing a new way to explore in-store sales conversations in order to improve training and monitoring of sales associates.
Problem statement
Training new sales associates is a hard time-consuming task. Making sure that new employees follow the training and comply with the guidelines could be even harder. Sales managers waste a lot of time trying to discreetly observe conversations with customers. They also need to understand how to motivate and grow their team members.
Users
The primary user is a manager who is interested in training sales associates and monitoring the quality of client-facing communication. This person is always on the lookout for new ways to keep their employees motivated and to improve the overall performance of their sales team.
Product designer
my role on the projectMy responsibilities
Define MVP product strategy
Research MVP users and define their interaction with the product
Design and deliver MVP product
Collaborate with leadership and engineering teams
Constraints
To limit the scope of this project we made the following assumptions:
The level of accuracy that could be achieved by the analysis algorithms is known / as-designed.
The dashboard targets only one user group and its goals (illustrated by the primary persona).
Introducing gamification concepts to the dashboard and reporting can enable primary users to develop new ways of sales associate training.
The product has defined usage requirements, and we assume that customers will comply with them to maximize their benefits.
Our default time period is a week - the dashboard shows weekly summaries and each week a new report is delivered.
Research
In order to understand and clearly visualize user interactions with the new product, I decided to create a future user journey map that would represent user interactions with the product on a weekly basis. To this end, I created a primary user persona that was based on user interview data and a detailed analysis of the online user communities. I used the future user journey map and the user persona to understand possible dashboard states, reports and notifications.
To make initial deployment more efficient, I outlined an initial on-boarding strategy for the MVP user.
Design Process
Previous research clearly suggested a number of pain points that could be alleviated with the help of an interactive dashboard. So my first design goal was to come up with an MVP design that could be quickly verified during a pilot test.
Once I completed the initial design, the engineering team populated it with 8 weeks of mock/synthetic data to see how the dashboard and the report would behave when real data starts pouring in. This process uncovered some issues with data visualization design, which I promptly fixed through an iterative approach.


Through an iterative approach, I designed a set of interactive reports and a dashboard. Right now, the final version of the MVP product is under active development.
What have I learned from this project?
Working with an early-stage startup is an entirely different game. The budget is tight. The time is short. This project taught me to look at many things in a new light and get creative when researching user needs. Here are a few examples:
When the technology is new, there are no existing users. Interview data from potential users are useful, but not enough to come with a good design.
In the B2B world, people who buy your product are often not the people who use it. I needed to get creative in order to get a better understanding of the actual users.
When designing an MVP it is important to keep in mind what features need to be there from day one and what can be added later.


